Procol • April 15, 2025
Procol • September 25, 2024 • 14 min read
Analyzing Spend: A Comprehensive Guide for All
Introduction
One of the most important strategies for achieving purchasing economies of scale is spend analytics. The process of obtaining, classifying, processing, analyzing spend, and evaluating purchase data is known as spend analytics.
Suppliers typically charge between 0.5% and 1% more than what the contract requires. In certain instances, like transportation, the variance might reach up to 4%. This leads to a disparity between a company’s perceived and actual savings. The purchasing division is under pressure because of this, so it is important to analyze spending. Such outcomes lessen the faith that venture capitalists or angel investors have in your business; thus, they will not provide the additional money.
What is spend analytics?
The strategy of identifying areas to save money, enhance strategic sourcing, and eventually lower expenses across the procurement process is known as spend analytics or spend analysis in procurement. By doing this, procurement expenses are expected to be reduced, and efficiency is expected to be improved through increased visibility and transparency. Real-time data and analytics provide you with the knowledge you need to increase productivity and save costs. It helps you make better decisions about sourcing and suppliers by visualizing all of the data.
It can also assist in lowering cycle times, enhancing contract compliance, and identifying maverick spending.
Spend analytics in procurement is used by businesses to make more informed decisions based on data and other factors like:
- Control the ties with suppliers
- Reduce the price of acquiring products and services, such as SaaS solutions
- Strike advantageous vendor agreements
- Boost procedures for supply chain management
- Put strategic sourcing into practice
- Boost the visibility of spending
How do you analyze spending patterns?
It is important to organize your spending data to analyze your company’s spending pattern thoroughly. This analysis might reveal which teams are spending the most money as well as whether business expenses are concentrated in particular areas. For example, you will now be able to analyze the spending patterns of each of your sales teams individually.
By analyzing your statistics, you can pinpoint particular problems with your expenses, such as:
- Overpayment of invoices: It’s possible that you paid some invoices more than necessary or that you paid them more than once.
- Currency conversion: If you’re working with foreign suppliers, you may be hit with conversion costs for expenses in specific currencies.
- Fraudulent spending: This analysis might be the first chance to examine the veracity of particular charges and determine whether any expenses are out of the ordinary.
- Overdue system enhancements: Spend analytics can show you where your systems need to be improved, especially in terms of keeping accurate and dependable spending data.
Why is spend analytics important?
Spend analytics is important for a company to avoid losing out on the insightful information that data can provide. Spend analytics uses financial predictions and historical data analysis to make sure spend analytics in procurement teams remain ahead of both present and future business needs. Having a better understanding of your company’s spending patterns will enable you to make more informed and effective purchases. Your likelihood of controlling your spending increases with knowledge about where and why your money is being spent. Examining historical spending data in detail might also assist you in streamlining your workflow.
What are the benefits of spend analysis?
Let us look at the benefits of spend analysis:
Enhanced effectiveness and transparency:
Only 20% of a company’s time is spent on strategy; the remaining 80% is devoted to low-value activities like data collection for reports and operations. Spend analysis in procurement data automatically boosts productivity and frees up time for important strategic tasks. Transparency is improved through spend analytics, which shows how much you’re spending on goods, supplies, and services.
Total visibility:
You may get a real-time picture of the entire organization with the spend analytics in the procurement system, which operates around the clock. Your purchasing selections are, therefore, proactive rather than reactive. The system operates across industries, including manufacturing, IT, and finance, and it shares insights with them.
Setting resource priorities:
Companies need to understand how to manage unforeseen expenses and allocate and prioritize their resources. In order to manage resources effectively, it is imperative to prioritize critical categories for corporate spending and find minor categories that hold significant potential. Spend analytics finds areas for savings and points of duplication, which helps your company make financial savings if distinct departments use different cleaning businesses.
Reduces risk:
There are two ways that spending analytics reduces risk. Firstly, you can assess the overall performance and reputation of each vendor while evaluating your company’s connection with vendors. For example, the credit score, delivery history, and complaint handling of a vendor may all be included in your expense analysis. Secondly, You can identify and lower risk on your end by using spend analytics in procurement. You can detect non-contracted or unapproved expenditures by seeing what and where your employees are buying.
How can spend analytics support procurement?
Spend analysis in procurement is gathered, examined, and reported. As a result, your business is better able to find areas for cost savings and make more informed sourcing selections by gaining insights into your spending patterns and key performance indicators (KPIs). Spend analytics in procurement supports and can help your business address a number of issues, including:
- Which categories do we spend the most on?
- Who are the leading vendors for us?
- Where is the money that we spend most of it?
- Are the conditions and rates we’re receiving the best possible
- Do we adhere to our buying guidelines?
- Is there any chance for us to combine our expenses?
- Are there any expenses that we can cut back on?
What happens under spend analytics?
Spend analysis is the process of examining spending data to look for trends, spot areas for savings, boost productivity, and enhance procurement strategy. To give insights, spending data from several sources must be gathered, classified, organized, and evaluated. Gaining visibility into spending’s main objectives are increasing financial efficiency and making better-informed procurement decisions.
On the contrary, spend analytics describes the more extensive use of sophisticated data analytics methods in spending information. Spend analytics goes beyond spend analysis by utilizing technologies like artificial intelligence (AI), machine learning, and predictive modelling, even though it still contains the fundamental components. This enables businesses to evaluate supplier risks, forecast future spending trends, and gain deeper insights that can inform strategic procurement choices, in addition to comprehending past spending patterns.
How to do an analysis in nine steps?
This is a generic nine-step spend analysis method. It is important to remember that every company is unique in how it runs and that it gains from having solutions tailored to meet its requirements.
1. Decide your spending analysis objective
Your finance team’s solid expense analysis technique functions best when it begins with a well-defined objective. The identification of that objective guides the search for pertinent data patterns.
2. Identify spend analysis data source
It is important to identify spend analysis data sources like finding more ways to save money within the sourcing categories, analyzing similar vendors’ returns on investment, lowering the risk associated with suppliers, and, employing taxonomy of classification to pinpoint expenses within more intricate spending.
3. Consolidate your sources of data
Two types of sourcing data are available:
- obtaining internal data sources from every division of the business to obtain up-to-date information on spending
- obtaining third-party data for benchmarking projects to enhance supplier management and help you close better transactions
A centralized platform that stores, processes, classifies, and extracts useful insights from data makes sourcing and centralizing data much easier. Procurement teams may ensure the accuracy of their data analysis efforts by maintaining a continuous feed of third-party and internal procurement data through API features and interfaces.
4. Cleanse spend data
Different time zones, currencies, languages, and other forms make up data. Setting every piece of data to the same time zone, currency, etc., may seem laborious, but it’s essential. If not, you might come to doubtful conclusions. Departments that categorize or describe the same products differently could be another source of discrepancies. Every team should enter this data in the same manner and with standardization.
The most crucial thing to do is check the spending data for mistakes or discrepancies. You might find duplicates, unintelligible data, or missing fields pertaining to contracts, categories, payments, and goods. Using other internal and external data sources, inaccurate information can frequently be retrieved from documents.
5. Streamline, normalize, and arrange your data
Making sure you are working with correct data is the first step in deriving insightful conclusions. Standardization, normalization, cleansing, and continuous management may be necessary for the data management process. While larger firms may conduct this during the initial stages of data collection and analysis, smaller businesses might not need to incorporate data cleansing operations. Onboarding software that facilitates data management is essential, depending on how straightforward or intricate your resource management initiatives are.
6. Continuous tracking of crucial spending data
Because expenditure data is constantly changing, you should perform frequent spending analyses. You may optimize your procurement process and concentrate on every possibility of savings by repeating these steps on a monthly or quarterly basis.
7. Utilize software for data analysis
At this point, you are prepared to draw conclusions from all of your data. Starting with a goal makes the analysis process easier, as was previously mentioned. To obtain crucial insights, you will utilize the reporting functionalities of your spend management software, which you may explore further.
8. Expenditure analysis
The process of weighing the advantages and disadvantages of various spending choices in order to maximize results is known as expense analytics. Organizations can use it to pinpoint areas where they are under-, over-, or spending in the incorrect places. Opportunities for cost savings can also be found through expenditure analysis. Hence expense analytics becomes an important step in how to do spend analysis.
9. Visualize the result of the analysis
If you can’t interpret the data, it’s useless, right? A clear and succinct presentation of the data is required. When conducting spend analysis in procurement, individuals have the option of compiling their results into reports manually or having the program handle it for them. Well-visualized data makes it simple to review, which saves time and effort for stakeholders and staff. Dashboards, Excel reports, PDFs, and shareable presentations containing tables, charts, graphs, and photos are just a few of the formats in which spend data reports can be found. All of the important components of the spend analytics should be shown separately in the report so that your teams can comprehend the present state of the business operations and any recommended changes.
Here are some examples of spend analysis
A multi-entity manufacturing corporation conducts inventory component orders with vendors from various business divisions of a Fortune 500 organization as an example of spending analysis. Suppliers are categorized by their parent firm and expenditure categories in its spend analysis assessment. When the manufacturer prepares a thorough spending analysis, these purchases of raw inventories are regarded as direct expenditures.
Spend data is recognized from all data sources to be aggregated, checked for consistency and mistakes, including standard formatting, and then consolidated using the spend analysis process. Trends and extreme exceptions are considered when analyzing the data. These vendors’ purchase order payment periods, costs, and inventory quantities are contrasted with those of rival vendors within the system.
Findings: The procurement departments of the manufacturing company may see a chance to save money by choosing new vendors or renegotiating with current suppliers to get better terms or quantity reductions. It is possible to enhance procurement procedures.
Best practices in spend analysis
- Regularly perform spend analysis.
- Examine the current spending management.
- Create a Strategy for Classification.
- Gather expenditure information from all external and internal sources.
- Keep tabs on the effectiveness of your vendors.
- Make your purchase procedure automated.
Spend analytics dashboard samples
A spend analytics dashboard is a dashboard designed to analyze spending data by visualizing it into charts. KPIs, business objectives, or predetermined criteria are used to choose datasets. A dashboard provides a high-level perspective of spending instantly.
Dashboard for spending overview
Through a comparison of data from one chosen period with the prior one, a Spend Overview Dashboard gives you an overview of your spending performance. The sample shows the data in four dimensions: Category, organization, supplier, and supplier count. The view is filtered by year-to-date. This kind of dashboard allows you to monitor supplier count advances, purchasing process advancements, spending adjustments by category, and the top suppliers by region. An interactive expenditure analytics dashboard should allow you to select and filter data on the charts immediately. You can use a spend analytics dashboard, depending on your duties, to quickly get answers to inquiries or achieve certain goals.
Spend analysis tools
Spend analysis can be done with a variety of tools and technologies, from basic Excel spreadsheets to analytics programs. Despite being on the market for more than 30 years, Microsoft Excel is still a great tool for creating robust dashboards that can quickly analyze data and offer insights. Also, many people analyze spending data with Excel, but they rarely do so in the most efficient and productive way possible. Typically, raw data is found for spending and categorized by supplier or name. When this information is organized into an Excel spreadsheet, it gives a business a comprehensive picture of its spending structure and aids in determining the supply chain segment that requires priority.
Even though Excel can be used for spend analysis, most companies will still run into problems. Excel, for instance, is not scalable when dealing with hundreds or thousands of rows of data.
Best spend analysis software company
A unified view of procurement spend, comprising information from purchase orders, invoices, and other company financial records, is provided by the best spend analysis software company, Procol. Purchase-to-pay suites, shareable Excel reports, and enterprise resource planning (ERP) systems are just a few of the sources from which spend data may be gathered.
Procol is the best spend analysis software company and the most reliable for carrying out this kind of analysis when compared to the other tools (Excel and BI).
Procol offers a comprehensive solution to manage spend analysis effectively. Its user-friendly interface, effective reporting and analytics, and valuable insights make Procol a preferable choice among various spend analysis software companies.
Founded in 2018, Procol is India’s ideal spend analysis software company that has been securely deployed at many $1B global companies. It has various unmatched features and capabilities that make it the best spend analysis software for your system.
What works for Procol:
- Next-generation platform to get all your spending under control and ultimately gain 2-10% cost savings.
- $100M+ generated savings by Procol customers.
- Empower teams with a dedicated mobile-first approach. It ensures spend analysis professionals have the flexibility they need to drive efficiency wherever they are.
- Businesses gain the flexibility of customizable workflows and templates that meet precise organizational needs.
- Gives access to 50,000+ suppliers registered and onboarded globally.
- Intuitive interface and unmatched efficiency ensure quick setup.
- Streamlines capex sourcing for maximum efficiency.
Conclusion
After you’ve sorted your spend analysis, you should think about the most important conclusions and the adjustments required to meet them. Your investigation might, for instance, draw attention to anomalies in the way that money is spent within particular cost categories or teams. More generally, this research might point to significant problems with spending patterns that necessitate a radical shift in the culture of the organization.
Make sure the appropriate teams are involved at the appropriate stages of whatever you need to do. For example, you must consult both your top management and your finance staff if you need to update your larger spending processes.
Explore more from Procol
Discover expert tips, how-to guides, industry insights, and the latest procurement trends.
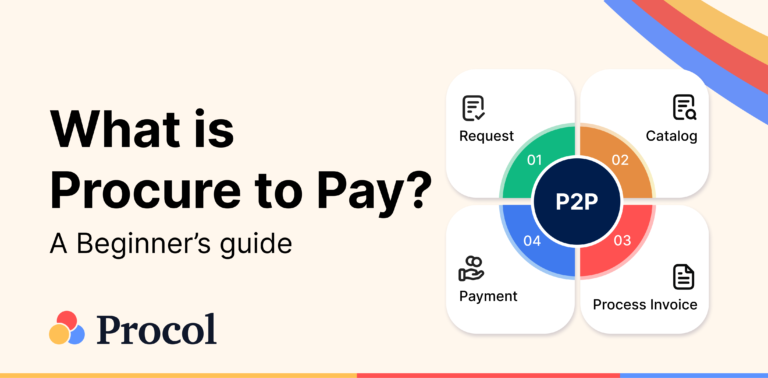
What is Procure-to-pay (P2P)? An Ultimate Guide
Procure to pay is the process from procurement of materials needed...

Best eSourcing Tools: Top 10 eSourcing Software in 2025
Discover top 10 e-sourcing tools and esourcing platforms necessary for efficient...
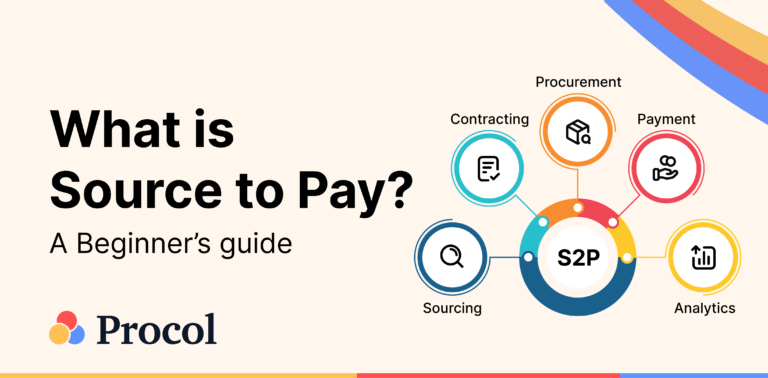
What is Source-to-pay in 2025? An Ultimate Guide
Source to pay is the process of sourcing vendors to procure...


